$ cat filling-the-gaps-in-aks-monitoring.md
Filling the Gaps kube-prometheus-stack Leaves on AKS
kube-prometheus-stack is a great starting point. One Helm chart gives you Prometheus, Alertmanager, Grafana, node-exporter, kube-state-metrics, around 35 dashboards and a couple of hundred alert rules from the kubernetes-mixin. For a long time I treated that as “monitoring done” on our AKS clusters, added a Teams receiver, and moved on.
Then I found a production node that Azure had scheduled for a hard redeploy because its host hardware was failing. The notice had been sitting on the node for ten days. Nothing alerted. Nobody looked.
That was the push to go through the stack properly and ask what it actually covers on AKS, what it misses, and which of its numbers you can’t trust there. This post is the result: the alerts I added, how I picked their thresholds, the one-page overview dashboard I was missing, and a few AKS-specific traps that make metrics lie. Everything below is plain Prometheus rules and Grafana JSON, deployed with Flux, so you can lift any of it into your own setup.
The Setup
The stack is deployed per environment with Flux: one HelmRelease for the chart, plus one Flux Kustomization per component under monitoring/<component>/, each holding the scrape objects and a PrometheusRule for that component (Flux, Kyverno, Envoy Gateway, External Secrets, Consul, CoreDNS, nodes). Each of those Kustomizations dependsOn the main one, which runs with wait: true, so on a fresh cluster the ServiceMonitor and PrometheusRule objects are only applied once the CRDs exist.
Alertmanager routes critical and warning alerts from platform namespaces, and cluster-wide alerts without a namespace label, to a shared Teams channel. Everything else stays visible in Alertmanager only. That routing detail matters for several decisions below: whether an alert carries a namespace label, and which one, decides whether a human ever sees it.
The Alert That Didn’t Exist
Here is what the node looked like:
kubectl get node aks-default-xxxxxxxx-vmss00000f \
  -o jsonpath='{.status.conditions[?(@.type=="VMEventScheduled")].message}'
Redeploy Scheduled: Thu, 29 Oct 2026 14:34:26 GMT. DurationInSeconds: -1.
Virtual machine has encountered a failure. For more information, see https://aka.ms/aks/scheduledeventsAKS runs node-problem-detector, which turns Azure Scheduled Events into a VMEventScheduled node condition, next to kernel and runtime conditions like KernelDeadlock, ReadonlyFilesystem or FrequentContainerdRestart. kube-state-metrics exports all of them as kube_node_status_condition. The chart, though, only alerts on Ready (KubeNodeNotReady, KubeNodeUnreachable) and on MemoryPressure/DiskPressure/PIDPressure (KubeNodePressure). Everything else node-problem-detector reports goes nowhere.
A Redeploy is not a polite event. The VM is stopped and started on another host without draining the node: pods die abruptly and the local temp disk is wiped. You want to cordon and drain that node yourself, in a quiet window, long before Azure does it for you.
Back-test before you write the rule
My first instinct was VMEventScheduled == 1 with a short for. Before writing anything, I asked Prometheus what that would have done over the last two weeks:
# minutes each node had the condition set, last 14 days
max by (node) (
  count_over_time((kube_node_status_condition{condition="VMEventScheduled",status="true"} == 1)[14d:1m])
)
Twelve nodes across dev and prod had the condition at least once, each for about 27 minutes. Those are routine platform maintenance notices: a Freeze of a few seconds during a host update, announced shortly before it happens. Paging on them would have produced a dozen meaningless Teams messages in two weeks. The one that mattered had been set for over 14,000 minutes.
So the rule waits an hour, which filters every routine notice I saw and still gives weeks of warning for a hardware Redeploy:
- alert: KubeNodeMaintenanceScheduled
  expr: |
    max by (node, condition) (
      kube_node_status_condition{job="kube-state-metrics", condition="VMEventScheduled", status="true"}
    ) == 1
  for: 1h
  labels:
    severity: warning
The max by (node, condition) is deliberate: it drops the namespace label kube-state-metrics adds (its own namespace), which turns this into a cluster-wide alert. With my routing, that’s what sends it to Teams, and the card then names the node instead of the namespace kube-state-metrics happens to run in.
Alerts That Explain Themselves
The metric only carries node and condition. The interesting part, the event type and its scheduled time, lives in the condition message, which never reaches Prometheus. And a lone KubeNodeProblemDetected: FrequentUnregisterNetDevice in a Teams channel at 3 a.m. is not something most people can act on.
So I made the annotations do the explaining. Prometheus expands annotations with Go templates, which means one rule can carry a different explanation for each value of a label:
- alert: KubeNodeProblemDetected
  expr: |
    max by (node, condition) (
      kube_node_status_condition{job="kube-state-metrics", status="true",
        condition=~"KernelDeadlock|ReadonlyFilesystem|FilesystemCorruptionProblem|KubeletProblem|ContainerRuntimeProblem|FrequentKubeletRestart|FrequentContainerdRestart|FrequentDockerRestart|FrequentUnregisterNetDevice"}
    ) == 1
  for: 10m
  labels:
    severity: warning
  annotations:
    summary: Node {{ $labels.node }} reports {{ $labels.condition }}.
    description: |-
      node-problem-detector set condition {{ $labels.condition }} on node {{ $labels.node }} for more than 10 minutes.

      **Possible reasons:** {{ if eq $labels.condition "KernelDeadlock" }}a kernel task has been blocked for over 2 minutes, usually stuck disk I/O or a kernel bug.{{ else if eq $labels.condition "ReadonlyFilesystem" }}the OS disk was remounted read-only after I/O errors. Containers can no longer write.{{ else if eq $labels.condition "FrequentUnregisterNetDevice" }}the kernel repeatedly waits to release a network device, a known bug triggered by pod network teardown.{{ else }}see the condition message on the node.{{ end }}

      **Check:** kubectl describe node {{ $labels.node }}, and kubectl debug node/{{ $labels.node }} for journalctl / dmesg.

      **Action:** cordon and drain the node, then replace it (az aks nodepool delete-machines) or reimage it with a node image upgrade.
(Shortened here; the real rule has a branch for every condition.)
Every custom alert now follows the same shape: what fired, possible reasons, how to check, what to do. For the maintenance alert, the “check” line is the exact kubectl ... jsonpath command from above, and runbook_url points to the Azure Scheduled Events docs. The Teams template already renders description as Markdown, so the bold headings come through.
Two practical notes:
{{ }}inside aPrometheusRuleis fine as long as the rule is a plain manifest. If you template rules through Helm, you have to escape them.- I validate the templates before shipping by rendering every branch with Go’s
text/template, prefixing{{$labels := .Labels}}{{$value := .Value}}the same way Prometheus does. It takes a minute and catches theif/else/endmistakes that would otherwise only show up as a broken alert at the worst possible time.
Back-Testing Every Threshold
The maintenance alert set the pattern for everything else: never pick a threshold from a blog post (this one included). Ask your own Prometheus what the signal looked like over the last week or two, then pick a value comfortably above the normal peak.
CoreDNS
The chart ships a good CoreDNS dashboard but no alert on failed answers. The obvious “error” response codes are misleading, though. With ndots:5, every pod lookup walks the search domains first, so NXDOMAIN is the majority of all answers (thousands per second on a busy cluster) and completely normal. NOTIMP is a client asking for a record type CoreDNS doesn’t support. The failures worth alerting on are SERVFAIL (upstream error or timeout) and REFUSED.
Over seven days, the peak for those two was 0.04 per second. The rules fire at 0.5 per second for 10 minutes, per response code and, separately, per upstream server:
sum by (rcode) (rate(coredns_dns_responses_total{job="coredns", rcode=~"SERVFAIL|REFUSED"}[5m])) > 0.5

sum by (to) (rate(coredns_proxy_request_duration_seconds_count{job="coredns", rcode="SERVFAIL"}[5m])) > 0.5
The second one names the upstream (a custom VNet DNS server, Consul DNS, …), which tells you immediately whether the problem is CoreDNS itself or something it forwards to. Add coredns_forward_healthcheck_broken_total and coredns_panics_total and you have five small rules that would have stayed silent for the whole back-test window.
TCP retransmits
The chart’s network alerts (NodeNetworkReceiveErrs, NodeNetworkTransmitErrs) count NIC errors. Packet loss beyond the NIC never increments those counters: SNAT port exhaustion on outbound connections, loss inside the Azure network, an overloaded peer. What does show it is TCP retransmissions, which node-exporter already exports:
max by (node) (
  (rate(node_netstat_Tcp_RetransSegs[5m]) / rate(node_netstat_Tcp_OutSegs[5m]) > 0.02
    and rate(node_netstat_Tcp_OutSegs[5m]) > 100)
  * on (namespace, pod) group_left (node)
    max by (namespace, pod, node) (kube_pod_info{created_by_kind="DaemonSet"})
)
The worst five-minute window per node over seven days was 1.3% on dev and 0.3% on prod. The alert fires at 2% for 15 minutes, only on nodes sending more than 100 segments per second, so an idle node retransmitting three packets doesn’t count. Its description lists the usual suspects (SNAT exhaustion, NIC or Azure network loss, an overloaded peer, MTU problems on VPN paths) and how to tell them apart: nstat and ss -ti on the node, and the Load Balancer’s SNAT metrics.
The kube_pod_info join maps the node-exporter series to the Kubernetes node name through the node-exporter pod. node-exporter’s own nodename label comes from the kernel hostname, which on AKS has a different case than the Kubernetes node name (vmss00000F vs vmss00000f). Put that into a kubectl command in the alert text and it simply fails.
Reducing Noise Without Losing Signal
Adding alerts is only half the job. Two upstream alerts were firing permanently on dev and prod and reaching Teams every 12 hours: KubeCPUQuotaOvercommit and KubeMemoryQuotaOvercommit. They compare the sum of all namespace ResourceQuota limits with node capacity, with a hard-coded 1.5 ratio. On our clusters that overcommit is known and accepted, so the alerts carry no information.
Disabling them (defaultRules.disabled) would work, but then they’re gone. The chart has a nicer knob: customRules overrides for and severity of individual default rules.
customRules:
  # Quota overcommit is known and accepted on our clusters: keep it visible in Alertmanager, not in Teams
  KubeCPUQuotaOvercommit:
    severity: info
  KubeMemoryQuotaOvercommit:
    severity: info
The Teams route only matches critical|warning, so info alerts stay out of the channel but remain visible in Alertmanager and in the dashboard’s alert list. That survives chart upgrades and doesn’t require copying the rule. The related alerts that compare pod requests with allocatable capacity stay at warning, so real capacity pressure is still caught.
A One-Page Cluster Overview
The default dashboards answer “how much CPU does X use?” very well. None of them answers “is this cluster healthy right now?”. Getting that picture meant opening five or six dashboards. So I built one more, from metrics that were already being scraped: kube-state-metrics, node-exporter, the kubelet, CoreDNS, and the chart’s own recording rules. No new scraping.
The top row is a set of counters that should all be green: nodes ready and not ready, node problems, pod phases, pods running but not ready, scrape targets down, firing alerts by severity, waiting containers, restarts in the last hour, degraded workloads, failed jobs.
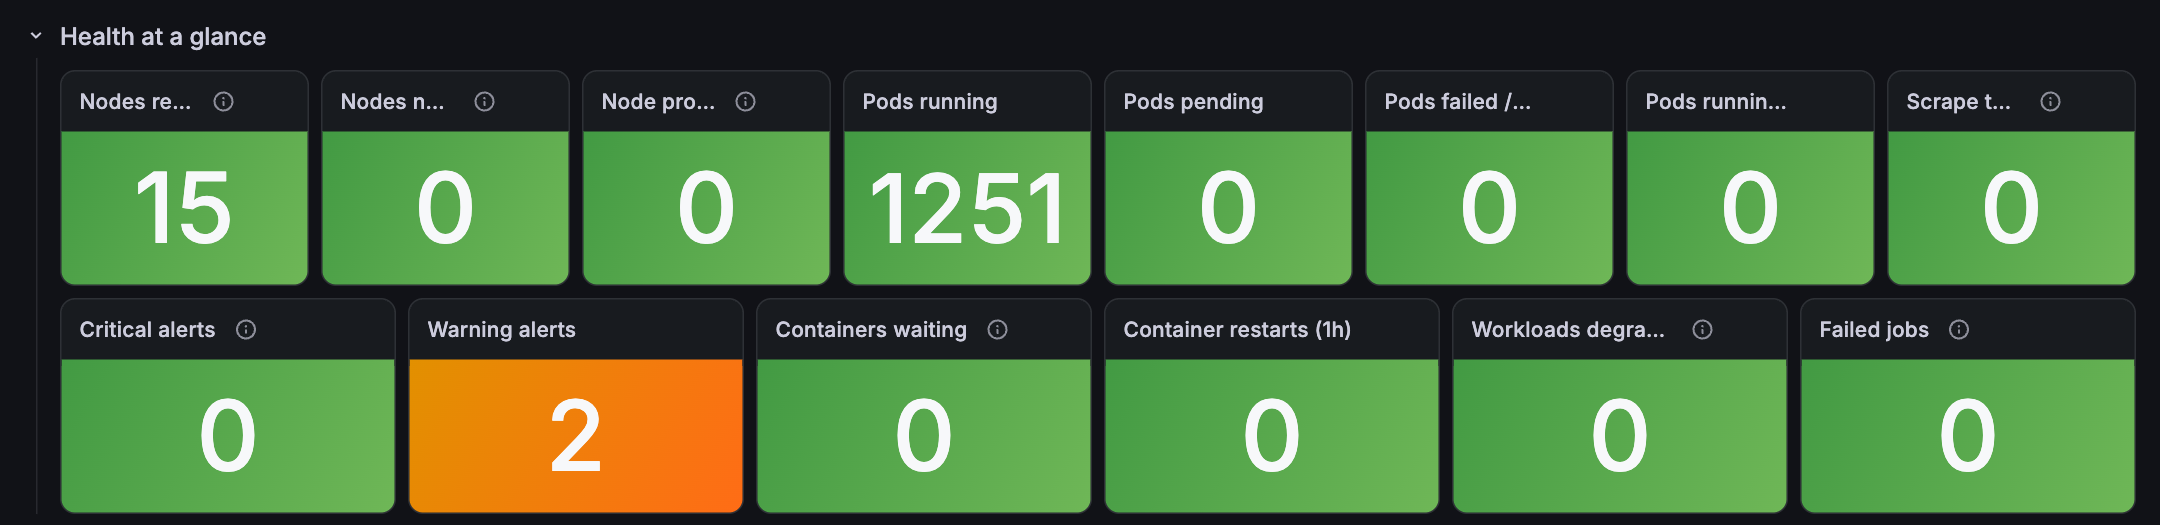
Below it are tables that only list problems (firing alerts, not-ready pods, waiting containers with their reason, top restarts with the last termination reason such as OOMKilled), then capacity: requested versus used versus allocatable, per node and per namespace.
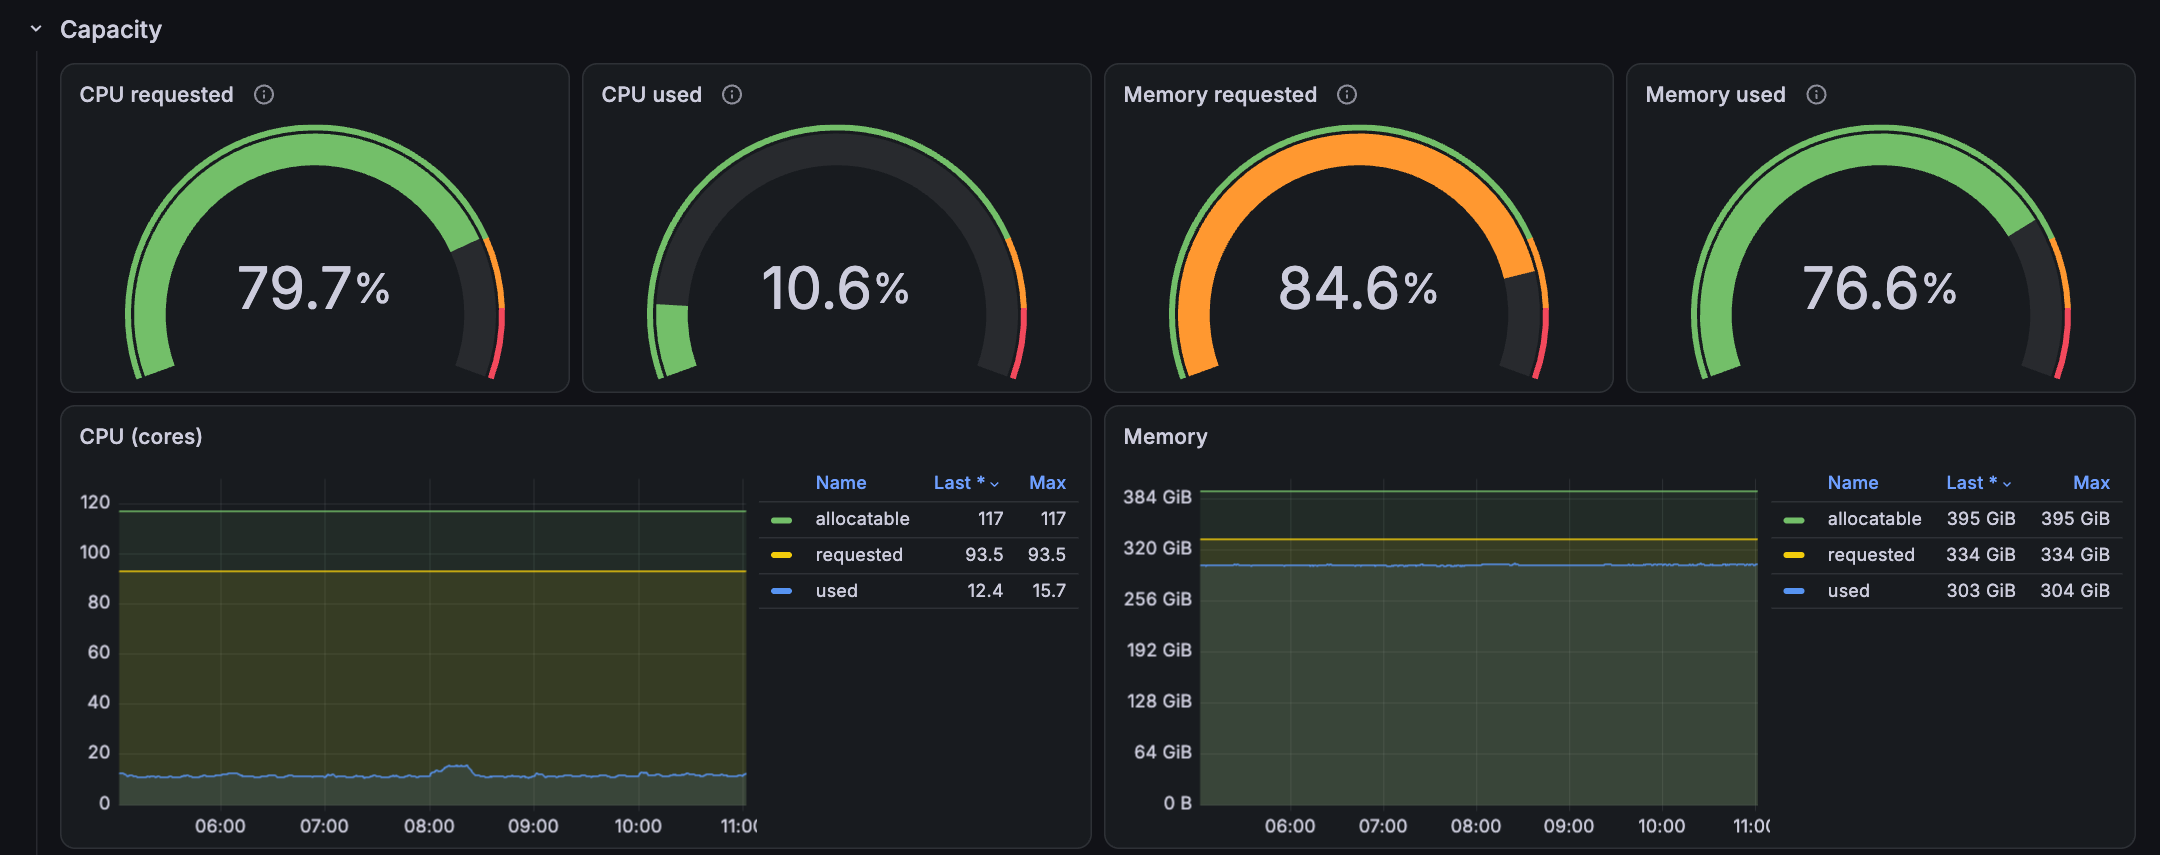
The capacity row explains a lot at a glance. On this dev cluster, 80% of CPU is requested but only about 10% is used, while memory requests and usage are both high. That is a very different conversation from “the cluster is full”.
The network row has node ingress and egress, the TCP retransmit ratio, the fullest node’s conntrack table, NIC errors and drops, and CoreDNS requests, failures and p99 latency:
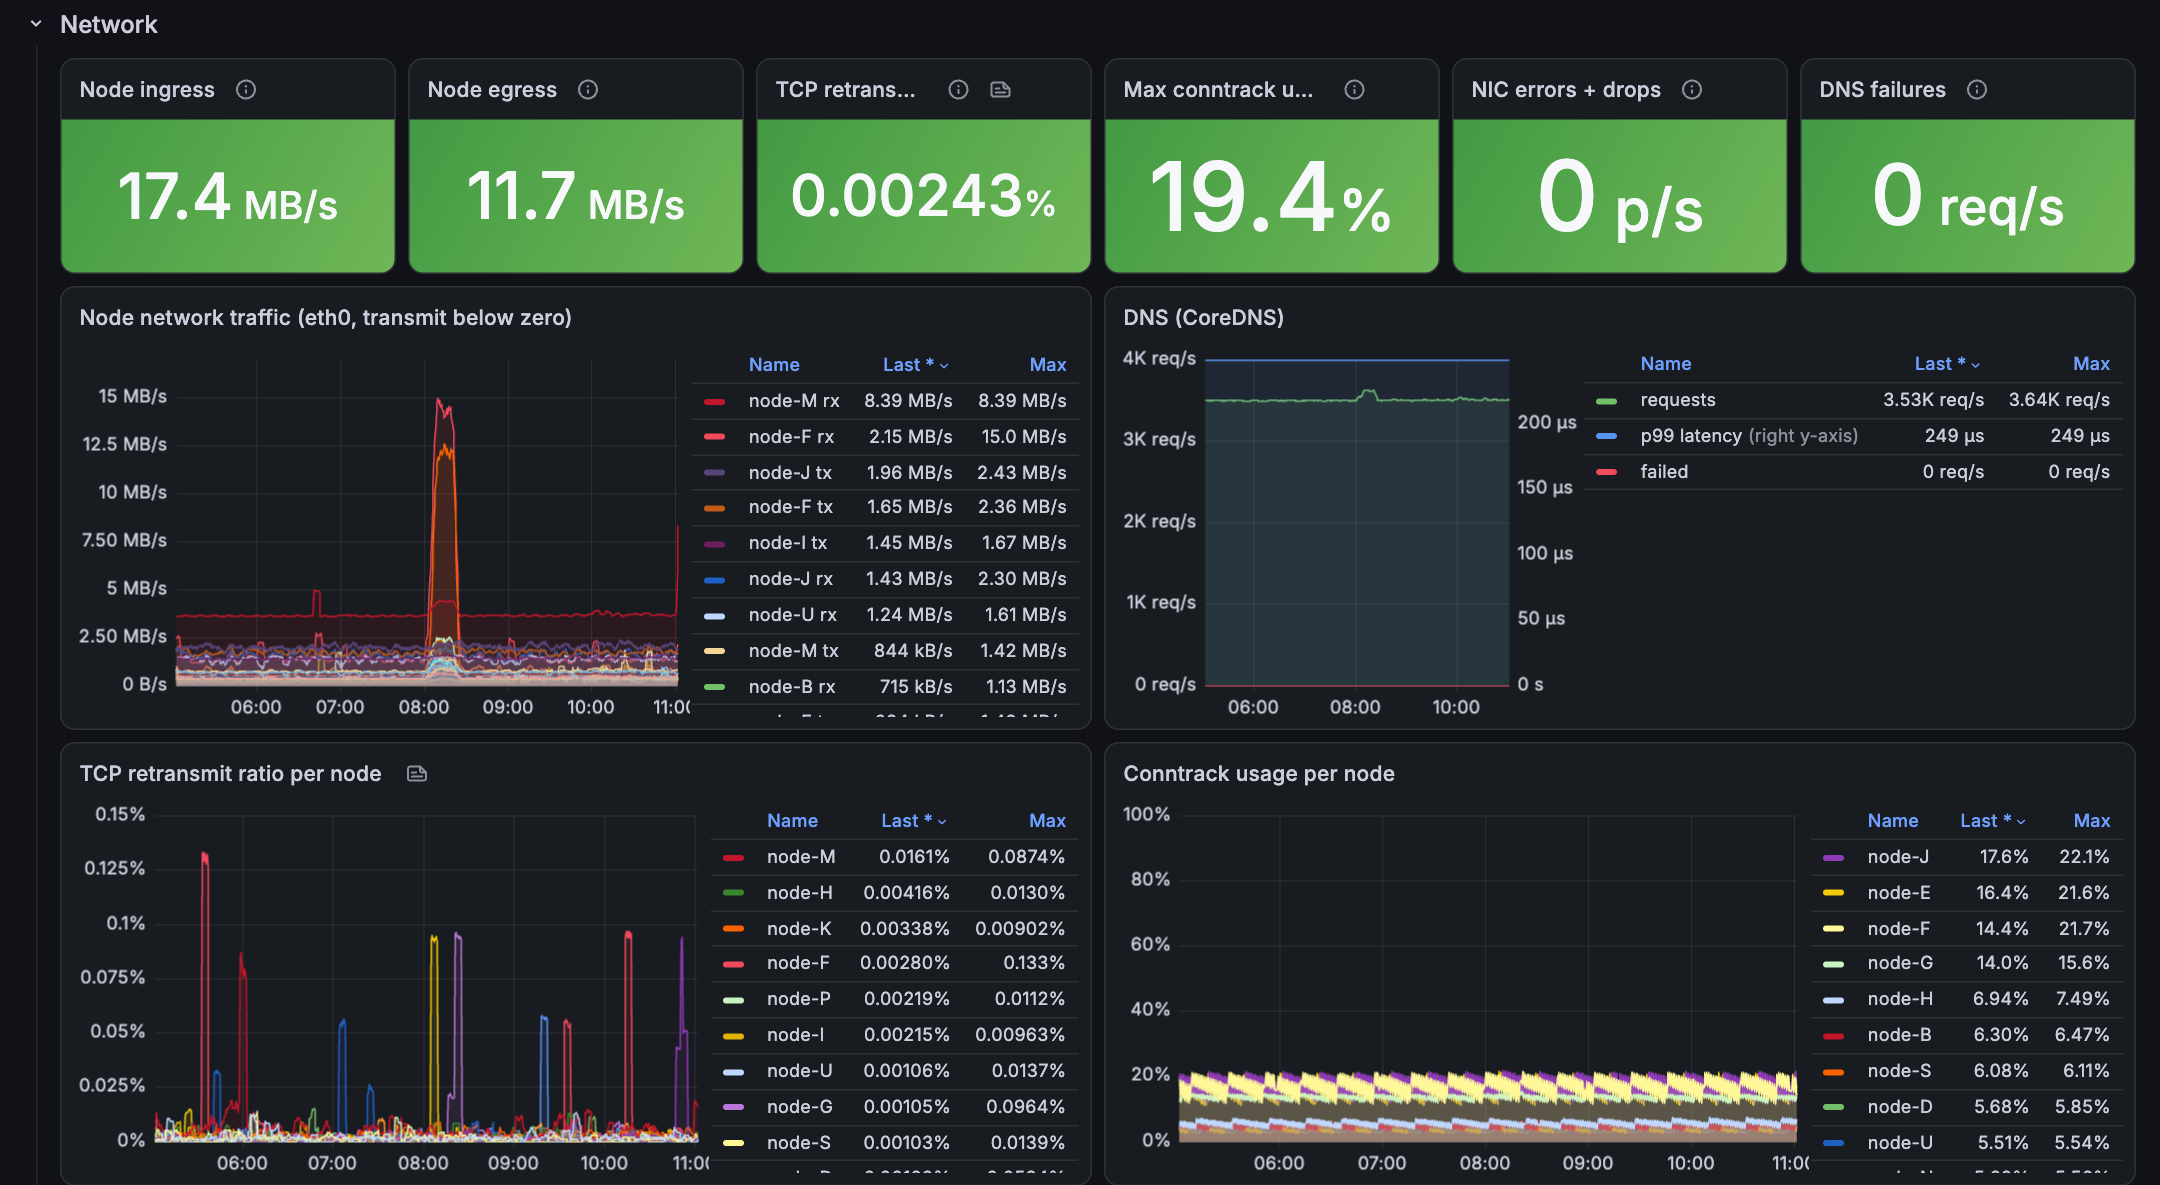
At the bottom, a platform row shows pod readiness per platform namespace, so components without metrics of their own (log shippers, reboot daemons, policy controllers) are still covered, plus scrape health per job:
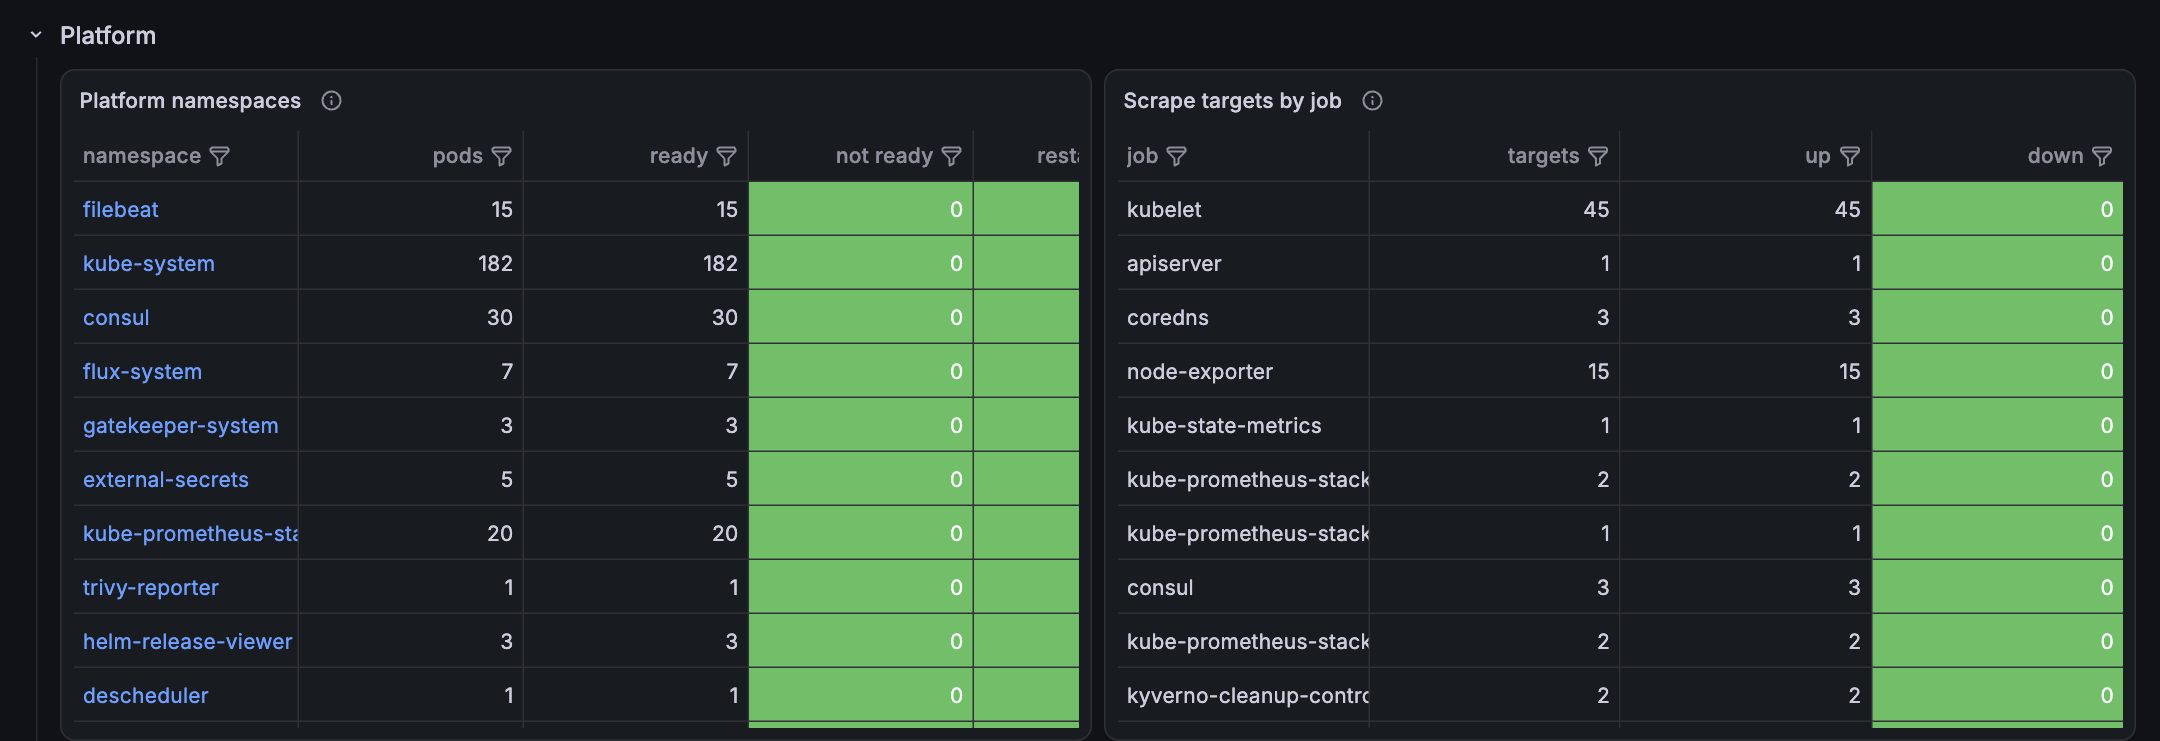
Links at the top go to the component dashboards and the built-in Compute Resources and Networking dashboards, and namespace and pod names in the tables link through to their detail dashboards. The whole thing is a ConfigMap with the grafana_dashboard: "1" label, so the Grafana sidecar picks it up like any other dashboard.
AKS Metric Traps
Building that dashboard was where I learned the most, because three of the numbers I first put on it were wrong.
The API server counters are useless
The chart scrapes the API server through the kubernetes service. On AKS, that endpoint load-balances across several managed API server replicas, and each scrape lands on a random one. You can see it directly:
changes(process_start_time_seconds{job="apiserver"}[1h])That returned about 95 per hour on both clusters, for a scrape every 30 seconds. Every switch looks like a counter reset to rate() and increase(), so request rates, error rates, latency histograms and the chart’s error-budget burn alerts are all computed from noise. One of my test queries showed roughly 600,000 HTTP 500s per hour, which obviously wasn’t happening. The burn-rate alerts never fired, and now I know that’s not reassurance.
What still works are gauges: up (so KubeAPIDown is fine), the number of objects per resource (apiserver_storage_objects, which is great for catching runaway policy reports), and in-flight requests. For real API server latency and error rates on AKS, use the Azure-side control-plane metrics instead.
Accelerated networking counts traffic twice
With accelerated networking, each AKS node has eth0 plus a second interface for the SR-IOV virtual function (enP<number>s1), and every pod adds an azv* veth. Sum node_network_receive_bytes_total over all devices and you count the same bytes two or three times. Node-level panels and alerts in my setup use device="eth0" only. The VF interface also reports a steady trickle of drops (about 0.5 per second on prod) that are harmless, which is why the drop alert ignores it too.
hostNetwork pods report the node’s traffic as their own
This one was the most convincing lie. My first “top namespaces by network traffic” panel showed kube-system moving 288 MB/s on prod, more than the whole node pool’s real traffic. Pods with hostNetwork: true (most kube-system DaemonSets: CNI, CSI drivers, the cloud node manager, security agents) share the node’s network namespace, so cAdvisor reports the node’s interface counters once per such pod. Ten hostNetwork pods per node means the node’s traffic is counted ten times, under kube-system. The same effect made it look as if every one of those pods was dropping packets.
The fix is to keep only each pod’s own interface and drop hostNetwork pods with a join on kube-state-metrics:
sum by (namespace) (
  rate(container_network_receive_bytes_total{interface="eth0"}[5m])
  * on (namespace, pod) group_left ()
    max by (namespace, pod) (kube_pod_info{host_network="false"})
)
With that, kube-system came down to a realistic 3.6 MB/s.
The general lesson from all three: when a number on a new dashboard looks surprising, assume the query is wrong before you assume the cluster is.
Housekeeping
Two small things made the setup nicer to live with.
A prefix for your own rules. The operator writes each PrometheusRule to a file named <namespace>-<name>-<uid>.yaml, and Prometheus and Grafana list rule groups in that order. My rules were called consul, kyverno, nodes and so on, and lived in the same namespace as the chart’s kube-prometheus-stack-* rules, so they were scattered around the chart’s 15 files. Renaming them to custom-<component> with groups custom-<component>.rules lists them as one block. Flux prunes the old objects, and alert names and labels don’t change, so routing is unaffected.
Monitors live with the monitoring, not with the component. The ServiceMonitors for Kyverno, Envoy Gateway and the External Secrets Operator are in the monitoring repo, not enabled in each component’s own chart. The component charts are installed early during cluster bootstrap, before the Prometheus Operator CRDs exist. Enabling their monitors there breaks a fresh cluster. Keeping them in Kustomizations that depend on the stack means they only apply once the CRDs are there.
What I Deliberately Left Out
Not everything that could be alerted on should be:
- SNAT port exhaustion isn’t visible from inside the cluster. It’s an Azure Load Balancer metric, so the retransmit alert points to it instead.
- Listen queue drops and UDP errors from node-exporter only cover the host network namespace. Application pods have their own, so these counters miss exactly the traffic you’d care about.
- External reachability (Key Vault, the container registry, the public ingress endpoints) needs blackbox-exporter and
Probeobjects. That’s the next piece, and a separate one.
Conclusion
None of this required a new tool. Every alert and panel above uses metrics kube-prometheus-stack was already collecting on day one. What was missing was the AKS-specific knowledge of which signals matter, which ones lie, and what a human needs to read in a Teams message to act on it.
If I had to keep only three habits from this work:
- Back-test every threshold against a week or two of your own data before shipping the rule. It took the maintenance alert from “a dozen false positives a fortnight” to “fires exactly once, for the event that mattered”.
- Make alerts explain themselves. Possible reasons, how to check, what to do, rendered per label value with Go templates. The person reading it at 3 a.m. might not be you.
- Distrust surprising numbers. A random API server replica per scrape, a second NIC, and hostNetwork pods each produced a convincing but wrong picture before I understood them.
And the node with the scheduled Redeploy? It’s now the one thing in the Node conditions table, with an alert in Teams that tells whoever reads it what the event is, when it will happen and how to get ahead of it.
$ comments --thread